



Follow Us:

Cost Savings & Budget Optimisation
Finding and Delivering the Savings Already Sitting in Your Vendor Base.

Cost Savings & Budget Optimisation

Most organisations are paying more than they should across at least three or four of their major spend categories. Not because their vendors are dishonest — but because no one has benchmarked the market, challenged the rates, or negotiated with proper preparation. The savings are there. They just need someone to go and get them.

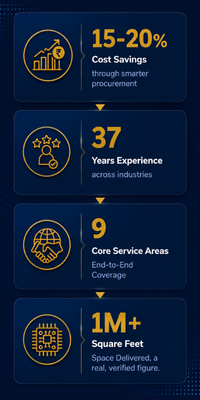
15-20%

Cost Savings
through smarter procurement

37

Years Experience
across industries

9

Core Service Areas

1M+

Square Feet
Space Delivered, a real, verified figure.

Where We Find Savings

Savings are available in almost every category — if you know where to look and how to ask.

IT Hardware
IT Hardware

Volume consolidation, framework agreements, and reseller renegotiation. Typical saving: 8 to 15%

Software Licences

Utilisation audit, seat reduction, renewal renegotiation, and enterprise agreement optimisation. Typical saving: 10 to 25%

Office Leases

Rent benchmarking, CAM charge audit, proactive renegotiation, and space optimisation. Typical saving: 10 to 20%

IT Services and AMC
IT Services and AMC

Rate benchmarking, scope optimisation, and SLA improvement. Typical saving: 5 to 12%

Facility Management

City-wise benchmarking, vendor consolidation, headcount verification, and rate renegotiation. Typical saving: 8 to 18%

Cloud Infrastructure

Idle resource elimination, right-sizing, and committed use discount strategy. Typical saving: 8 to 20%

Admin and Employee Services

Consolidated purchasing, preferred vendor arrangements, and policy controls. Typical saving: 5 to 10%

How We Report Savings

Every saving is verified by your finance team before it is officially recorded. No saving is claimed that has not been independently confirmed. The savings register is presented to the CFO at every monthly steering committee meeting — showing delivered savings versus target, year to date, by category.

Hard savings

Direct reduction in actual spend versus prior year or baseline contract value

Cost avoidance

Vendor increase proposed and successfully resisted through negotiation

Rate protection

Current rates locked for a future period through multi-year commitment

Finance-Verified Savings

All savings verified by finance team before official recording

CFO Savings Dashboard

Cumulative savings dashboard presented to CFO monthly

Document

What You Receive

The Virtual CPO engagement is structured as a monthly retainer — with a defined set of activities and deliverables agreed at the outset.

Monthly CPO Report to CFO

Strategy, savings delivered, pipeline, vendor highlights, and risks

Attendance at monthly CFO
Executive Leadership Reporting

Attendance at monthly CFO or leadership meetings to present procurement performance

Commercial Governance

Oversight and sign-off on all significant vendor negotiations and contract decisions

Mentorship & Capability Building

Mentoring sessions with your procurement team lead — building their capability and confidence

Strategic category reviews

Strategic category reviews — ensuring the organisation is buying at the best available terms

12-Month Transformation Roadmap

Representation of procurement interests in any board discussion, M&A process, or investor review

One of the most significant sources of cost in any organisation is maverick spend — purchases made outside the approved procurement process, often at above-market rates and from unapproved vendors.

The Maverick Spend Problem

We identify the current level of maverick spend, address the root causes, and implement controls that reduce it to below 5% of total spend within 12 months. This alone typically delivers 0.8 to 1.2% of total spend as a measurable saving.
One of the most significant sources of cost in any organisation is maverick spend — purchases made outside the approved procurement process, often at above-market rates and from unapproved vendors.

The Maverick Spend Problem

We identify the current level of maverick spend, address the root causes, and implement controls that reduce it to below 5% of total spend within 12 months. This alone typically delivers 0.8 to 1.2% of total spend as a measurable saving.